GIA. quadratic function
Consider an expression of the form ax 2 + in + c, where a, b, c are real numbers, and is different from zero. This mathematical expression is known as the square trinomial.
Recall that ax 2 is the leading term of this square trinomial, and is its leading coefficient.
But the square trinomial does not always have all three terms. Take for example the expression 3x 2 + 2x, where a=3, b=2, c=0.
Let's move on to the quadratic function y \u003d ax 2 + in + c, where a, b, c are any arbitrary numbers. This function is quadratic because it contains a term of the second degree, that is, x squared.

It is quite easy to plot a quadratic function, for example, you can use the full square method.
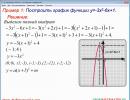
Consider an example of plotting a function y equals -3x 2 - 6x + 1.
To do this, the first thing to remember is the scheme for highlighting the full square in the trinomial -3x 2 - 6x + 1.
We take out -3 from the first two terms in brackets. We have -3 times the sum of x squared plus 2x and add 1. Adding and subtracting the unit in brackets, we get the formula for the square of the sum, which can be collapsed. We get -3 times the sum (x + 1) squared minus 1, add 1. Expanding the brackets and adding like terms, the expression comes out: -3 times the square of the sum (x + 1) add 4.
Let's build a graph of the resulting function by going to the auxiliary coordinate system with the origin at the point with coordinates (-1; 4).
In the figure from the video, this system is indicated by dotted lines. We bind the function y equals -3x 2 to the constructed coordinate system. For convenience, we take control points. For example, (0;0), (1;-3), (-1;-3), (2;-12), (-2;-12). At the same time, we set aside them in the constructed coordinate system. The parabola obtained during the construction is the graph we need. In the figure, this is a red parabola.

Applying the full square selection method, we have a quadratic function of the form: y = a * (x + 1) 2 + m.
The graph of the parabola y \u003d ax 2 + bx + c is easy to obtain from the parabola y \u003d ax 2 by parallel translation. This is confirmed by a theorem that can be proved by taking the full square of the binomial. The expression ax 2 + bx + c after successive transformations turns into an expression of the form: a * (x + l) 2 + m. Let's draw a graph. Let's perform a parallel movement of the parabola y \u003d ax 2, combining the vertex with the point with coordinates (-l; m). The important thing is that x = -l, which means -b / 2a. So this line is the axis of the parabola ax 2 + bx + c, its vertex is at the point with the abscissa x, zero is equal to minus b divided by 2a, and the ordinate is calculated by the cumbersome formula 4ac - b 2 /. But this formula is not necessary to memorize. Since, by substituting the value of the abscissa into the function, we get the ordinate.
To determine the axis equation, the direction of its branches and the coordinates of the parabola vertex, consider the following example.
Let's take the function y \u003d -3x 2 - 6x + 1. Having drawn up the equation for the axis of the parabola, we have that x \u003d -1. And this value is the x-coordinate of the top of the parabola. It remains to find only the ordinate. Substituting the value -1 into the function, we get 4. The top of the parabola is at the point (-1; 4).
The graph of the function y \u003d -3x 2 - 6x + 1 was obtained by parallel transfer of the graph of the function y \u003d -3x 2, which means that it behaves similarly. The leading coefficient is negative, so the branches are directed downwards.
We see that for any function of the form y = ax 2 + bx + c, the easiest question is the last question, that is, the direction of the branches of the parabola. If the coefficient a is positive, then the branches are up, and if negative, then they are down.

The next most difficult question is the first question, because it requires additional calculations.
And the most difficult is the second, because, in addition to calculations, knowledge of the formulas by which x is zero and y is zero is also needed.
Let's plot the function y \u003d 2x 2 - x + 1.
We determine immediately - the graph is a parabola, the branches are directed upwards, since the leading coefficient is 2, and this is a positive number. According to the formula, we find the abscissa x is zero, it is equal to 1.5. To find the ordinate, remember that zero is equal to a function of 1.5, when calculating we get -3.5.
Top - (1.5; -3.5). Axis - x=1.5. Take the points x=0 and x=3. y=1. Note these points. Based on three known points, we build the required graph.
To plot the function ax 2 + bx + c, you need:
Find the coordinates of the vertex of the parabola and mark them in the figure, then draw the axis of the parabola;
On the x-axis, take two points that are symmetrical about the axis of the parabola, find the value of the function at these points and mark them on the coordinate plane;
Through three points, construct a parabola, if necessary, you can take a few more points and build a graph based on them.
In the following example, we will learn how to find the largest and smallest values of the function -2x 2 + 8x - 5 on the segment.
According to the algorithm: a \u003d -2, b \u003d 8, then x zero is 2, and zero y is 3, (2; 3) is the top of the parabola, and x \u003d 2 is the axis.
Let's take the values x=0 and x=4 and find the ordinates of these points. This is -5. We build a parabola and determine that the smallest value of the function is -5 at x=0, and the largest is 3 at x=2.
Tasks on the properties and graphs of a quadratic function, as practice shows, cause serious difficulties. This is rather strange, because the quadratic function is passed in the 8th grade, and then the entire first quarter of the 9th grade is "tortured" by the properties of the parabola and its graphs are built for various parameters.
This is due to the fact that forcing students to build parabolas, they practically do not devote time to "reading" graphs, that is, they do not practice comprehending the information received from the picture. Apparently, it is assumed that, having built two dozen graphs, a smart student himself will discover and formulate the relationship between the coefficients in the formula and the appearance of the graph. In practice, this does not work. For such a generalization, serious experience in mathematical mini-research is required, which, of course, most ninth-graders do not have. Meanwhile, in the GIA they propose to determine the signs of the coefficients precisely according to the schedule.
We will not demand the impossible from schoolchildren and simply offer one of the algorithms for solving such problems.
So, a function of the form y=ax2+bx+c is called quadratic, its graph is a parabola. As the name suggests, the main component is ax 2. That is A should not be equal to zero, the remaining coefficients ( b And With) can be equal to zero.
Let's see how the signs of its coefficients affect the appearance of the parabola.
The simplest dependence for the coefficient A. Most schoolchildren confidently answer: "if A> 0, then the branches of the parabola are directed upwards, and if A < 0, - то вниз". Совершенно верно. Ниже приведен график квадратичной функции, у которой A > 0.
y = 0.5x2 - 3x + 1
In this case A = 0,5
And now for A < 0:
y = - 0.5x2 - 3x + 1
In this case A = - 0,5

Influence of coefficient With also easy enough to follow. Imagine that we want to find the value of a function at a point X= 0. Substitute zero into the formula:
y = a 0 2 + b 0 + c = c. It turns out that y = c. That is With is the ordinate of the point of intersection of the parabola with the y-axis. As a rule, this point is easy to find on the chart. And determine whether it lies above zero or below. That is With> 0 or With < 0.
With > 0:
y=x2+4x+3

With < 0
y = x 2 + 4x - 3

Accordingly, if With= 0, then the parabola will necessarily pass through the origin:
y=x2+4x

More difficult with the parameter b. The point by which we will find it depends not only on b but also from A. This is the top of the parabola. Its abscissa (axis coordinate X) is found by the formula x in \u003d - b / (2a). Thus, b = - 2ax in. That is, we act as follows: on the graph we find the top of the parabola, determine the sign of its abscissa, that is, we look to the right of zero ( x in> 0) or to the left ( x in < 0) она лежит.
However, this is not all. We must also pay attention to the sign of the coefficient A. That is, to see where the branches of the parabola are directed. And only after that, according to the formula b = - 2ax in determine sign b.
Consider an example:

Branches pointing upwards A> 0, the parabola crosses the axis at below zero means With < 0, вершина параболы лежит правее нуля. Следовательно, x in> 0. So b = - 2ax in = -++ = -. b < 0. Окончательно имеем: A > 0, b < 0, With < 0.
A bad teacher teaches the truth, a good teacher teaches to extract it.
A.Disterweg
Teacher: Netikova Margarita Anatolyevna, teacher of mathematics, school No. 471 of the Vyborgsky district of St. Petersburg.
Lesson topic: “Graph of a functiony= ax 2 »
Lesson type: learning lesson.
Target: teach students how to graph a function y= ax 2 .
Tasks:
Tutorials: develop the ability to build a parabola y= ax 2 and establish a pattern between the graph of the function y= ax 2
and coefficient A.
Developing: development of cognitive skills, analytical and comparative thinking, mathematical literacy, the ability to generalize and draw conclusions.
Educators: education of interest in the subject, accuracy, responsibility, exactingness to oneself and others.
Planned results:
Subject: be able to determine the direction of the branches of the parabola by the formula and build it using the table.
Personal: be able to defend their point of view and work in pairs, in a team.
Metasubject: be able to plan and evaluate the process and result of their activities, process information.
Pedagogical technologies: elements of problem-based and advanced learning.
Equipment: interactive whiteboard, computer, handouts.
1. The formula for the roots of a quadratic equation and the factorization of a quadratic trinomial.
2. Reduction of algebraic fractions.
3.Properties and function graph y= ax 2 , dependence of the direction of the branches of the parabola, its "expansion" and "compression" along the ordinate axis on the coefficient a.
Lesson structure.
1. Organizational part.
2.Updating knowledge:
Checking homework
Oral work according to ready-made drawings
3. Independent work
4.Explanation of new material
Preparation for learning new material (creating a problem situation)
Primary assimilation of new knowledge
5. Fixing
Application of knowledge and skills in a new situation.
6. Summing up the lesson.
7. Homework.
8. Lesson reflection.
Technological map of an algebra lesson in grade 9 on the topic: “Function graphy=
ax 2
»
| Lesson stages | Stage tasks | Teacher activity | Student activities | UUD |
| 1. Organizational part 1 minute | Creating a working mood at the beginning of the lesson | Greets students checks their preparation for the lesson, notes those who are absent, writes the date on the board. | Preparing to work in the classroom, greet the teacher | Regulatory: organization of educational activities. |
| 2.Updating knowledge 4 minutes | Check homework, repeat and summarize the material studied in previous lessons and create conditions for the successful completion of independent work. | Collects notebooks from six students (selection of two from each row) to check homework for grade (Annex 1), then works with the class on the interactive whiteboard (appendix 2). | Six students hand in notebooks with homework for checking, then answer the questions of the frontal survey (appendix 2). | Cognitive: bringing knowledge into the system. Communicative: the ability to listen to the opinions of others. Regulatory: evaluation of the results of their activities. Personal: assessment of the level of assimilation of the material. |
| 3. Independent work 10 minutes | Check the ability to factorize a square trinomial, reduce algebraic fractions and describe some properties of functions according to its graph. | Gives students cards with an individual differentiated task (Appendix 3). and solution sheets. | Perform independent work, independently choosing the level of difficulty of exercises by points. | Cognitive: Personal: assessment of the level of assimilation of the material and their capabilities. |
| 4.Explanation of new material Preparing to learn new material Primary assimilation of new knowledge | Creating a favorable environment for getting out of a problem situation, perception and comprehension of new material, independent coming to the right conclusion | So, you know how to graph a function y= x 2 (charts are pre-built on three boards). Name the main properties of this function: 3. Vertex coordinates 5. Intervals of monotonicity What is the coefficient for this case? x 2 ? In the example of the square trinomial, you saw that this is not necessary at all. What sign can it be? Give examples. How parabolas with other coefficients will look like, you have to find out for yourself. The best way to study something is to discover for yourself. D.Poya We divide into three teams (in rows), choose the captains who go to the board. The task for the teams is written on three boards, the competition begins! In one coordinate system, construct graphs of functions 1 team: a) y=x 2 b) y= 2x 2 c) y= x 2 2 team: a) y \u003d - x 2 b) y \u003d -2x 2 c) y \u003d - x 2 3 team: a) y=x 2 b) y=4x 2 c) y=-x 2 Mission accomplished! (Annex 4). Find functions that have the same properties. Captains consult with their teams. What does it depend on? But how do these parabolas still differ and why? What determines the "thickness" of the parabola? What determines the direction of the branches of a parabola? We will conditionally call the schedule a) "initial". Imagine an elastic band: if you stretch it, it becomes thinner. This means that graph b) was obtained by stretching the original graph along the y-axis. How is graph c) obtained? So, at x 2 can be any coefficient that affects the configuration of the parabola. Here is the topic of our lesson: "Function Graphy= ax 2 » | 1. R 4. Branches up 5. Decreases by (- Increasing by )  Recent Articles
|